CoolTool Blog
Eye Tracking Metrics: What are They and What They Say
Eye tracking is a technology that allows you to observe respondents viewing patterns and understand what a person is looking at. It is a quick and easy way to analyze how your target audience reacts to the marketing tools you employ for communication and which tools work and which do not.
It can be applied for different purposes – testing of websites, advertising, packaging design, etc. Furthermore, regardless of the purpose of its application you can be always sure that you will receive comprehensive data provided through a number of standard metrics. It’s very convenient, especially when you are planning to test the same object and track its evolution – are there any differences in customers’ perception of the website after the change of the design, are text blocks became more readable after reshuffling, etc.
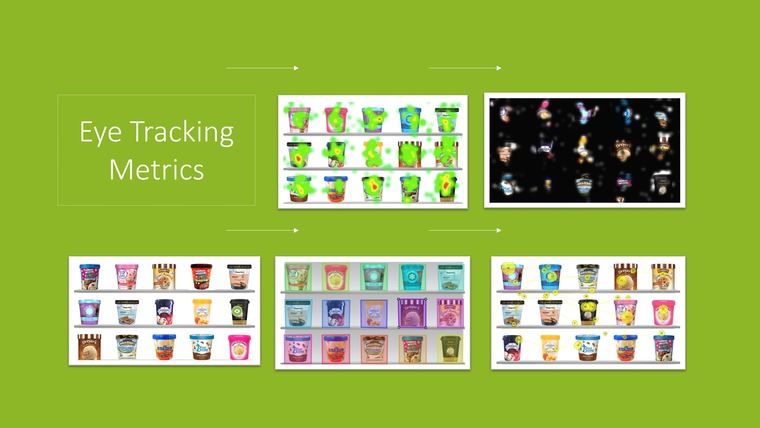
Eye tracking provides 10+ basic metrics including easy-to-read visualizations (heatmaps, gaze plots, opacity maps, etc.) as well as comprehensive statistical indicators (fixation count, fixation duration, fixations before, etc.). As the result, with the help of eye-tracking, you can get the full picture of respondents’ attention fluctuations, analyze them and adjust tested objects according to your goals and customers’ preferences.
Let’s take a closer look at the aforementioned eye tracking metrics in order to better understand why they serve an added value to any market research.
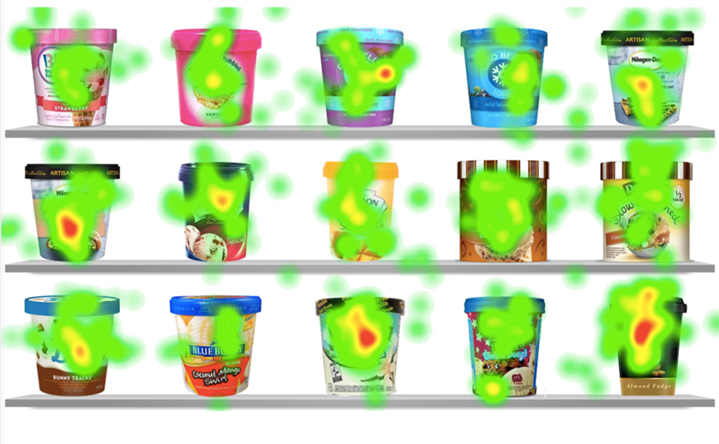
Heatmap
Heatmap – an image that shows the distribution of sight fixation and gaze points on the tested object. A very convenient tool when you want to compare your product with competitors and understand whether its design stands out and attracts attention.
 Gaze plot
 Gaze plot
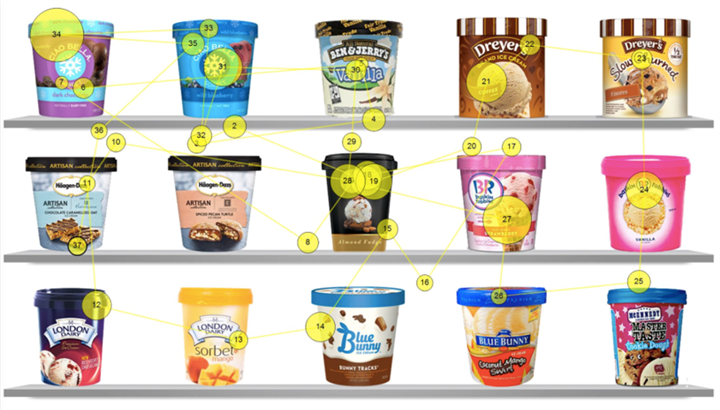
Gaze plot – shows how the sight of the respondent moved in course of the test. Allows identifying areas which were the most and least attractive for respondents.
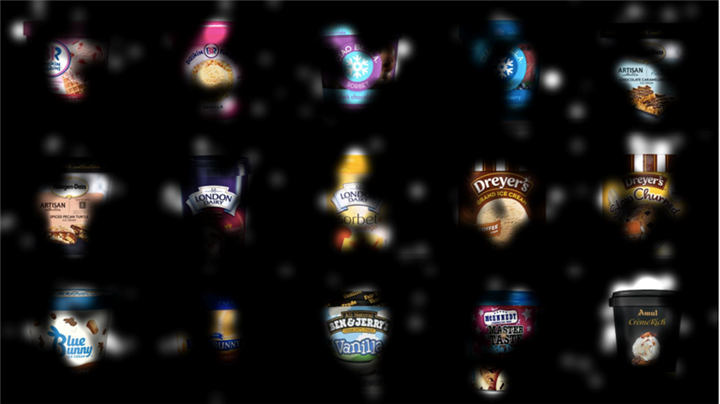
Opacity map
Opacity map – is another way to visualize the heat map data. Here the most “attractive” areas of the image are lighted up while others are dimmed down depending on the level of interest the respondent expressed to a particular part of the image in course of the test.
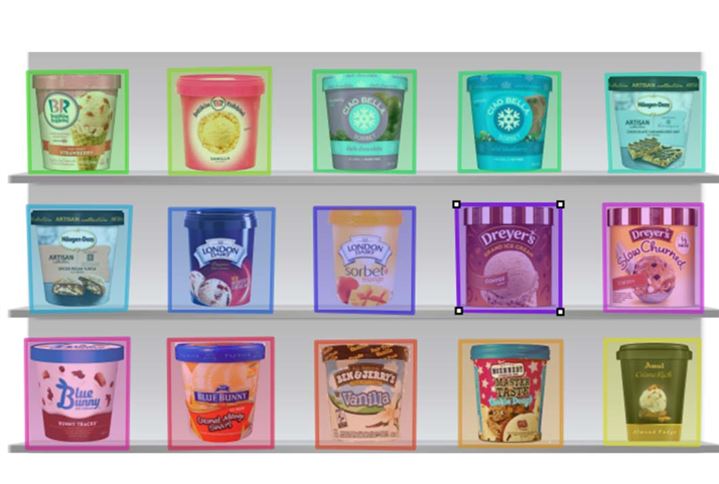
Areas of interests
Areas of Interest – is a spot on the tested image that you can select in order to get detailed statistics, particularly on this area. The very effective metric for testing particular parts of the product/packaging design.
Other metrics
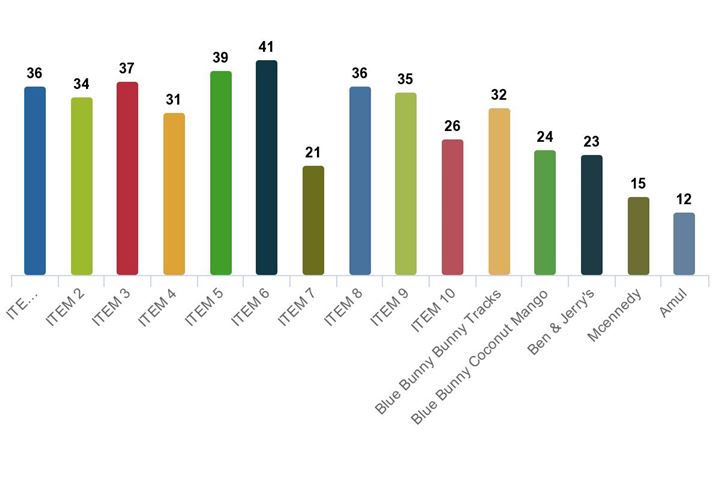
Fixation count – a metric that tracks the number of times the respondent looked at the particular area to read the text or observe an object. It demonstrates which parts of the tested image/object attracted attention the most.
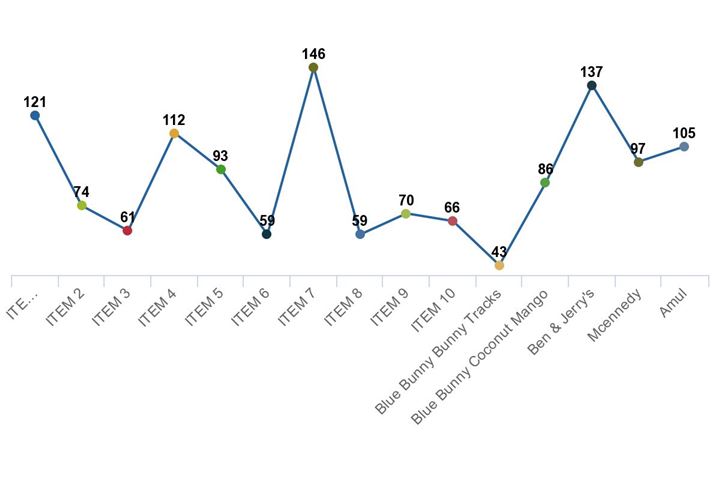
Fixation duration – shows for how long a respondent looked at the particular area of interest.
Fixations before – an interesting metric that demonstrates where the respondent looked before focusing on the particular area of interest you’ve chosen for the test. It allows to analyze the respondent’s gaze journey and if required to shorten it based on the results of the test.
Fixation participants’ count – demonstrates how many respondents fixated their gaze on the selected object at least once.
Time to the first fixation – a metric reflecting the time it took a respondent to fix his/her sight on the selected area of interest. You can choose several AOIs and then compare which of them were the most attractive for respondents.
Observation duration – shows for how long (in seconds) a respondent looked at AOI. It registers the moment when a person fixated his/her gaze on the AOI and the moment when the person moved the gaze outside the area of interest.
Observation count – reflects how many times respondents returned to a particular AOI in course of the test. Within this metric, the number and length of gaze fixations at AOI are also registered.
Eye tracking can provide a lot of valuable information about the perception of the tested object by consumers which would be hard to grasp with any other research tools. At the same time, if combined with other tools for measuring explicit and implicit responses, such as emotion measurement, for example, eye tracking can be an even more powerful research instrument.
CoolTool platform allows you to combine technologies and cross-analyze conscious and unconscious data within a few hours.